
Rue89 | 30/12/2012 à 16h16
Rencontre avec l’auteure d’un livre porteur d’espoir : partout dans le monde, des citoyens s’organisent pour subvenir à leurs besoins et inventer une autre société.
A l’heure où la phrase de Margaret Thatcher « There is no alternative » (au libéralisme, à la rigueur budgétaire) n’a jamais été autant dans la bouche des dirigeants, il est bon de rappeler la réponse de Susan George : « There are thousands of alternatives ».
La journaliste Bénédicte Manier est partie de la deuxième assertion et, pendant deux ans, est allée voir ce qui fait bouger la société civile, les graines de changement semées partout et qui inventent un « autre monde possible ». Elle en a ramené un livre passionnant, « Un million de révolutions tranquilles »(Editions Les liens qui libèrent), qui fourmille d’utopies réalisées.
Des assemblées villageoises qui gèrent l’eau en Inde aux banques citoyennes en Espagne, elle décrit le fonctionnement de quelques-unes des solutions susceptibles de contourner la grande machine capitaliste.
Rue89 : Qu’est-ce qu’une « révolution tranquille » exactement ?
Bénédicte Manier : Ce sont des changements locaux, qui se mettent en place silencieusement pour résoudre les problèmes auxquels la population est confrontée – chômage, pauvreté, malnutrition, dégâts sur l’environnement… –, défis que les pouvoirs publics semblent impuissants à résoudre. Alors les citoyens décident d’agir eux-mêmes. Et aujourd’hui, on assiste à un foisonnement d’initiatives sur tous les continents, de solutions locales facilement transférables d’un pays à l’autre.

Couverture du livre de Bénédicte Manier
En agriculture, on voit émerger de nouvelles zones d’autosuffisance alimentaire, avec des réformes agraires menées par les habitants eux-mêmes ou la régénération d’écosystèmes grâce à l’agroforesterie et au bio. En Afrique, en Asie, en Amérique latine, des coopératives créent de l’emploi et sortent de la pauvreté des milliers d’oubliés de la croissance.
Une autre façon d’habiter les villes a aussi émergé, avec partout l’essor de coopératives de logement et de l’agriculture urbaine (New York, par exemple, compte 800 jardins partagés). Contre la spéculation, des filières d’épargne citoyennes se sont développées.
Pour les exclus du système de santé, des citoyens américains ont ouvert 1 200 cliniques gratuites. Contre la « malbouffe », les consommateurs japonais ont adhéré par millions aux « Teikei » (les Amap locales) et aux coopératives d’achat direct aux fermiers. Ils ont aussi créé leurs propres services (crèches, emplois familiaux…). Dans des domaines très variés, la société civile reprend ainsi en main les enjeux qui la concernent et devient un vrai moteur du changement social.
De quand datent ces initiatives ?
Certaines d’il y a vingt ans, mais depuis une dizaine d’années, les changements sont devenus très visibles dans le domaine de la consommation. Les classes moyennes des pays industrialisés ont largement adopté la « consommation collaborative », qui consiste à acheter moins, mais mieux, et entre soi : on achète d’occasion, on partage, on loue, on troque, on répare au sein d’ateliers participatifs, on échange des services sans argent…
En bref, on développe les « 4 R » (réduire, réutiliser, réparer, recycler). On se tourne aussi vers le local et le bio, pour savoir ce qu’on mange et soutenir l’économie de proximité. Et en imposant ces nouveaux comportements, la société civile a en partie réorganisé la distribution et amorcé une transition vers des modes de vie plus économes et plus écologiques.
C’est ce qu’on appelle le « penser global, agir local », que Coline Serreau avait décrit dans son dernier film ?
Exactement. C’est une évolution profonde : les gens se rendent compte que le modèle de développement actuel a trouvé ses limites et souhaitent d’autres logiques que le tout-marchand. En soutenant une coopérative locale ou uneAmap, en échangeant dans un système d’échange local (SEL) ou en plaçant son épargne dans l’économie solidaire, le citoyen contribue à une activité économique qui répond mieux à ses valeurs.
Est-ce aussi ce qu’on appelle l’économie de la débrouille ?
Oui, mais pas seulement. L’« économie de la débrouille » donne l’impression que c’est uniquement déclenché par la crise. En réalité, cela fait plusieurs années que les classes moyennes ont silencieusement changé de valeurs. Par exemple, quand une petite partie d’entre elles se détache des banques commerciales pour aller vers des circuits financiers solidaires, c’est parce qu’elles cherchent du sens et veulent voir leur argent servir à autre chose que la spéculation. Ce changement d’aspiration date d’avant la crise et celle-ci n’a fait que l’accentuer.
Quels sont les profils concernés ?

Bénédicte Manier (DR)
On a affaire à des générations très connectées, très informées, conscientes des grands enjeux et qui ne se retrouvent plus dans l’hyperconsommation, mais davantage dans des comportements conviviaux et coopératifs.
Les consommateurs sont ainsi devenus des acteurs des filières ; en partageant leurs outils de bricolage, leurs maisons (Couchsurfing) ou en organisant leurs propres circuits de livraison de colis par covoiturage, ils mettent en place une économie collaborative, ce qu’explique Anne-Sophie Noveldans son livre « Vive la co-révolution ».
Les logiciels libres notamment sont issus de cette coopération transversale. C’est une forme de déclaration d’indépendance vis-à-vis de l’économie classique, qui se fait sans vraiment d’idéologie, mais plutôt avec pragmatisme. C’est finalement une génération post-mondialisation, qui en a adopté les outils (Internet, smartphone), mais qui les met au service d’actions citoyennes participatives et décentralisées.
Décroissants, créatifs culturels, sous quelle bannière les regrouper ?
Certains sont dans l’une ou l’autre tendance, mais beaucoup n’entrent dans aucune. Les créatifs culturels sont ceux qui dans les années 1990 ont créé une autre manière d’être au monde, en étant davantage dans l’être que dans l’avoir. Mais aujourd’hui, le changement s’est élargi à d’autres groupes sociaux. Je ne me hasarderais pas à quantifier, mais visiblement le changement concerne une bonne partie des classes moyennes.
Deux livres parus en 2010 aux Etats-Unis ( « Consumed : Rethinking Business in the Era of Mindful Spending » et « Spend Shift : How the Post-Crisis Values Revolution Is Changing the Way We Buy, Sell, and Live ») ont montré que 72% des habitants des pays industrialisés ont adopté des modes d’achat plus écologiques et plus sociaux, et que 55% des ménages américains ont mis en place une consommation « démondialisée », en adhérant à des valeurs d’autosuffisance, de « do it yourself » ou d’achat sur les marchés fermiers locaux.
Quelle peut être la traduction politique de tout cela ?
Ces changements silencieux se font en dehors des groupes constitués, c’est typique des sociétés en réseaux où l’on se regroupe entre voisins ou en groupes informels aidés par les réseaux sociaux. Il n’y a pas de relais politique : les citoyens ont plus ou moins intégré l’idée qu’on ne change pas le monde avec un parti politique, ce qui exprime une sorte de fatigue de la démocratie, comme l’explique Pierre Rosanvallon.
Et ils ne descendent plus dans la rue. La contestation des Indignés et du mouvement Occupy Wall Street a d’ailleurs trouvé ses limites et ces groupes se réinvestissent maintenant dans les initiatives concrètes. Les Indignés espagnols créent par exemple des coopératives de logement et des systèmes d’échange gratuit de services. On n’est plus dans la protestation, mais dans le passage à l’acte.
Est-ce que le nouveau réseau social Newmanity est susceptible de leur donner plus d’occasions de se rencontrer et plus d’écho ?
Il est intéressant de voir se développer des réseaux sociaux davantage liés à ce changement d’aspirations. Cette nouvelle génération de réseaux va au-delà de la simple mise en relation, pour proposer du sens : elle propose de partager les mêmes valeurs éthiques. Et si Newmanity diffuse ces initiatives de changement, il va sans doute accélérer leur progression, notamment par une logique de « translocal », une reproduction d’un territoire à un autre.
Parmi les acteurs importants, il y a le Québec. Qu’a-t-on à apprendre de lui ?
Les coopératives d’habitants se sont beaucoup développées là-bas, car la société civile a créé des structures de professionnels qui aident les gens à transformer des bâtiments désaffectés en habitats coopératifs, ou à concevoir des immeubles écologiques et conviviaux où on habite ensemble en mutualisant les charges. Les logements sont à l’abri de la spéculation et sont loués nettement en dessous du marché. Au Québec, on en compte 1 200, qui logent 50 000 personnes.
Elles se sont aussi développées en Allemagne, en Angleterre, en Suède, aux Etats-Unis… mais peu en France, pays très réglementé et plus colbertiste. Les« Babayagas » ont ainsi eu beaucoup de mal à créer une forme d’habitat coopératif : parce qu’il n’entre dans aucune case administrative, elles ont dû passer par un office HLM. De même, il est difficile ici de créer des coopératives d’énergies renouvelables, notamment parce qu’il faut revendre son électricité à EDF, qui a baissé ses tarifs de rachat. L’individualisme joue aussi sans doute un rôle.
Les initiateurs de l’expérience des éoliennes citoyennes en Pays de Vilaine ont ainsi ramé pendant dix ans ! Mais ailleurs, ça se développe : au Danemark, 86% des parcs éoliens appartiennent à des coopératives de citoyens. Et en Allemagne, une quarantaine de villages sont déjà autonomes en électricité et se la revendent entre eux, préfigurant ce que Jeremy Rifkin appelle la Troisième révolution industrielle.
Quels sont les projets les plus avancés en France ?
Chez nous, ce qui marche bien, ce sont les circuits courts, les monnaies locales, la consommation collaborative ou, dans une certaine mesure, l’épargne solidaire, avec par exemple Terre de liens pour sauver les fermes de terroir. Mais une coopérative financière comme la NEF reste bien moins importante que les grandes coopératives d’épargne américaines (les « credit unions »), ou que la Coop57– coopérative catalane grâce à laquelle les particuliers financent directement l’économie solidaire locale –, ou encore que les banques sociales et écologiques comme la Triodos Bank des Pays-bas ou la Merkur Bank du Danemark.
Article original sur le site de Rue89.
« Un million de révolutions tranquilles » peuvent-elles faire une grande révolution ?
Je décris une évolution des mentalités lente mais réelle, qui va certainement se développer car elle est portée par les classes moyennes, ces « trendsetters » qui fixent les normes de demain. Est-ce qu’un jour tout cela atteindra une masse critique ? Je n’en sais rien, mais on est certainement dans une transition. Les citoyens vont plus vite que les politiques, et ils inventent de nouveaux comportements parce qu’ils ont envie de vivre mieux. Ce mouvement « bottom up » est certainement amené à se développer.
Comme dirait Pierre Rabhi, changer le monde nécessite de changer soi-même, non ?
Les gens ont déjà cette intuition que les théoriciens de la décroissance comme Rabhi, Latouche, Viveret, les penseurs de la transition, Rob Hopkins, formulent. Ce sont des initiatives encore minoritaires, mais qui se multiplient maintenant d’un bout à l’autre de la planète, montrant que quelque chose est en train de bouger à la base de la société. Quand des habitants commencent à transformer l’habitat, l’agriculture ou d’autres les aspects de la vie quotidienne, on est peut-être en train de passer à une autre époque.
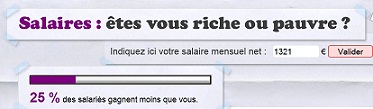
 se considère comme pauvre ou sur le point de le devenir. | AFP/FREDERICK FLORIN")